Necessity of LED Lights Parameter Measurement
Compared with traditional lighting products, LED lights have many advantages such as energy saving, long life, and environmental friendliness.
With the development of LED technology, the share of corresponding lighting products in general lighting, automobiles, agriculture and other application fields continues to increase. With the continuous promotion of applications, the requirements for the accuracy of LED lights measurement results are getting higher and higher.
However, the accuracy of the measurement is not only determined by the instrument calibration and testing process, but is also closely related to the characteristics of the tested sample. These factors all become a component of the uncertainty of the measurement results.
For example, to evaluate the performance of an LED product, the most commonly used indicator is luminous flux. The luminous flux test results are easily affected by factors such as lamp holder type, ambient temperature, stability of the lamp power supply, and warm-up time.
For the same lighting product, different measurement methods are used, and the results are also different. These uncertain factors seriously affect the healthy development of the LED lighting market.
Therefore, in order to better understand the measurement differences of LED lighting products and improve the consistency of measurement and testing in the LED lighting industry, this comparison has important practical significance.
1. Comparison Process and Arrangement
The general process of the comparison is to first transfer the selection of the sample, including the calibration of the measuring equipment, and conduct the first test of the LED products to be selected. Then it undergoes a certain period of aging process, among which a certain number of lamps with good performance are selected as the transfer standard.
The leading laboratory conducts the first test of the transmission standard, and then other laboratories conduct the test. After the test is completed, the delivery sample is sent to another laboratory for testing. After the test is completed, the sample is returned to the provider who delivered the sample. Lead the laboratory to conduct secondary tests in order to monitor the stability of the comparison and transfer samples. Finally, the two parties exchanged and analyzed experimental data.
1) Screening of samples
The sample screening is mainly obtained through the preliminary aging experiment. All selected LED samples are randomly selected in the lighting market, including at least 10 LED bulb lights, 10 LED downlights, and 10 LED street lights.
Before the test, in order to ensure the consistency of the test results and reduce the impact of the instability of the LED lighting products themselves, all the LED lighting products were aged 1 000 H in a normal temperature environment before the experiment. Then select a sample with good performance as the transfer sample.
Among them, the luminous flux of the LED bulb takes the average of 10 bulbs, and the CCT takes the average of the color temperature of 10 bulbs. It can be seen that after 400 h of aging test, the performance of the sample tends to be stable.
In order to ensure the accuracy of the test, the initial aging time of this comparison is set at 1,000 h. Finally, 3 LED bulbs, 2 LED downlights, and 2 LED street lights are selected to form a set of samples to be tested.
2) Sample delivery route.
The comparison test was carried out between six laboratories. Each country selects 3 laboratories, and selects a representative laboratory as the leading laboratory.
One set of delivery samples provided by one country is called series A, and the other set of samples provided by another country is called series B. For series A, the order of sample delivery is Lab 3, Lab 5, Lab 6, Lab 1, Lab 2, Lab 4, and Lab 3 is the leading laboratory. For series B, the order of sample delivery is Lab 1, Lab 2, Lab 4, Lab 3, Lab 5, Lab 6, and Lab 1 is the leading laboratory.
2. Comparing Technical Requirements
1) The standard on which it is based
All test samples are tested in accordance with the relevant standards of this type of lamp. Including GB/T 29295-2012 “Reflective self-ballasted LED lamp performance test method”, GB/T 29296-2012 “Reflective self-ballasted LED lamp performance requirements”, IES LM-79-08 “Approved Method: Electrical and Photometric Measurements of Solid-State Lighting Products”, IES LM-80-08 “Approved Method: Measuring Lumen Maintenance of LED Light Sources”.
2) Environmental conditions and warm-up time.
The test environment conditions stipulate that the temperature is (25±1) ℃, and the relative humidity does not exceed 65%. The thermal stabilization time before the LED sample test is 2 h.
The selection of the preheating time is very important. Only a reasonable preheating time can be selected to ensure that all reference laboratories conduct tests under the same conditions.
Because LED products have different thermal dispersion designs, the time for different products to reach thermal equilibrium is different. The thermal stability of LED bulbs is relatively poor and requires a long stabilization time. Compared with indoor downlights and outdoor street lights, the required stabilization time is shorter.
The figure below shows the change of the luminous flux of the LED bulb lamp over time. When the preheating time exceeds 60 minutes, the luminous flux tends to be stable. However, in order to ensure the accuracy of the test data, the thermal stability time of all LED test samples is set to 2 h.
Fig.1 Change of the luminous flux for one LED retrofit lamp with time
3) Test equipment.
According to the characteristics of different transmission standards, a spherical photometer or a distributed photometer can be used for measurement. For LED bulbs, both spherical photometers (ie integrating spheres) and goniophotometers can be used for measurement. For indoor downlights and outdoor street lights, goniophotometers are mainly used for measurement. The calibration of all test equipment used is calibrated by the national metrology institute.
3. Comparison Results
(1) Analysis method
Standard deviation is the most commonly used statistical analysis method, used to measure the degree of dispersion of data distribution, to measure the degree of data value deviation from the arithmetic mean. The smaller the standard deviation, the less these values deviate from the average. vice versa. The calculation formula is as follows:(1)
Here, xi is the measured value of each sample, and `x is the average of all measured values. The calculation formula is:
Study of preservative systems in soap-based cleansers 2 20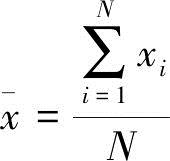 (2)
(2)
CV is the coefficient of variation, which is used to indicate the degree of dispersion of the data. It is the ratio of the standard deviation of the original data to the average of the original data. The calculation formula is: (3)
(3)
(2) Analysis of comparison results
A total of 6 laboratories participated in this measurement comparison test. For bulb lamps, the measuring equipment is an integrating sphere and a C-γ goniophotometer.
Among them, Series A is a general term for LED lighting products. Series B is another general term for LED lighting products. For series A, the leading laboratory is laboratory 3. For series B, the leading laboratory is laboratory 1.
The normalized analysis of the test results of these two series of samples by different laboratories. The maximum and minimum deviations are identified, and the measurement result of the leading laboratory is used as the standard value. All deviations are obtained from the test results of the leading laboratory.
The deviation of the test data of the bulb lamp is within ±5%. Among them, the consistency of the test results of series B is better, and the consistency of test results of series A bulbs is poor. The biggest deviation is shown in the test results of the bulb lamp 1-1 in Lab 2, and the deviation is -4.9%.
Through analysis, it can be concluded that the deviation of the test data of LED downlights and LED street lights is also within ±5%. However, due to the narrow beam angle of the downlight, the integrating sphere is not the best choice for testing LED indoor downlights. The test results show relatively large volatility, especially for the series A indoor downlight 2-10, the measurement deviation is the largest, which is -4.8%.
4. Conclusion
Using LED bulbs, LED downlights and LED street lights as transmission standards, the luminous flux and color temperature were measured and compared. The results of the comparison show that although the laboratories have adopted different test equipment, test methods and calibration methods, the measurement error of the luminous flux of these lighting products is within ±5%, the measurement deviation of CCT is within ±250 K, and the deviation of CV is within ±250 K. Within 4%.
Therefore, as long as the test equipment is calibrated according to the specified cycle and tested under the specified test conditions, the deviation of the test results among the six different laboratories is within the acceptable range. The comparison will provide a measurement reference for the international trade and technical exchange of LED products.


