Aiming at the current road lighting problem of LED street lamps, this paper uses DIALUX software to model the road lighting scheme. Research and analyze whether the lighting effect of LED street lamp meets the international lighting standard CIE under the premise of fixed LED light source power and light distribution curve.
According to the analysis results of optical simulation modeling, the key factors affecting the lighting effect of LED street lamps are obtained: the installation method of the illuminator, the installation height of the LED pole, the installation distance of the LED pole, the light source power of the illuminator, and the light distribution curve of the illuminator . And put forward effective and feasible LED road lighting solutions.
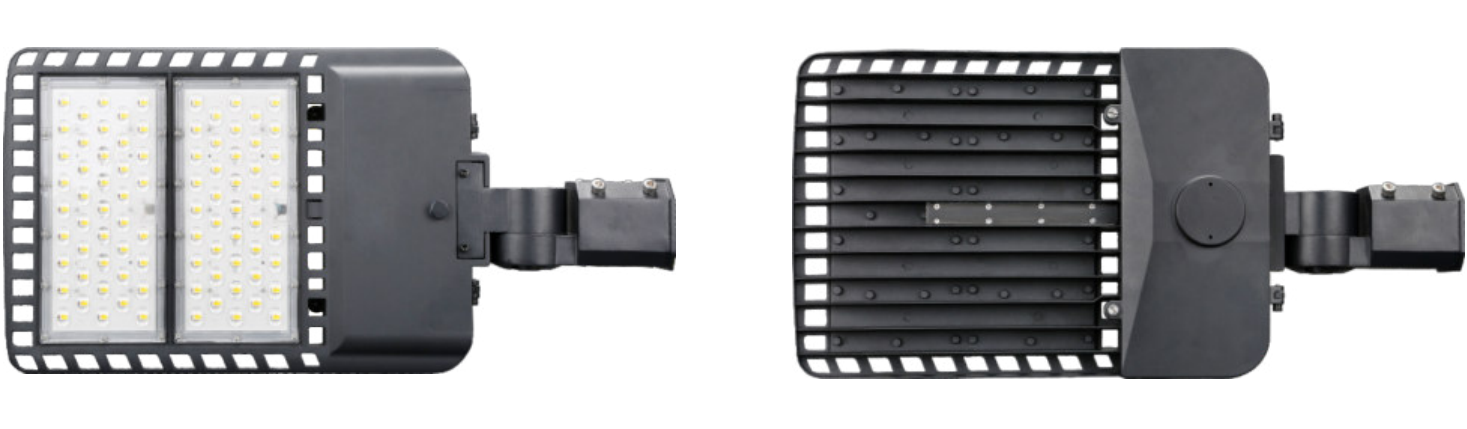
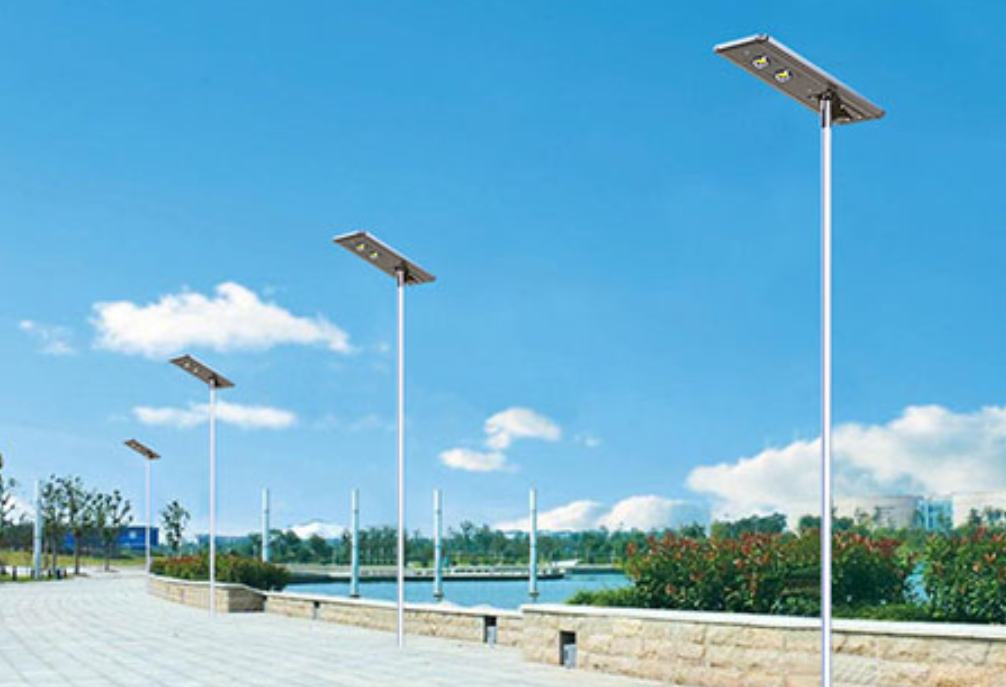
Figure 1 LED street light
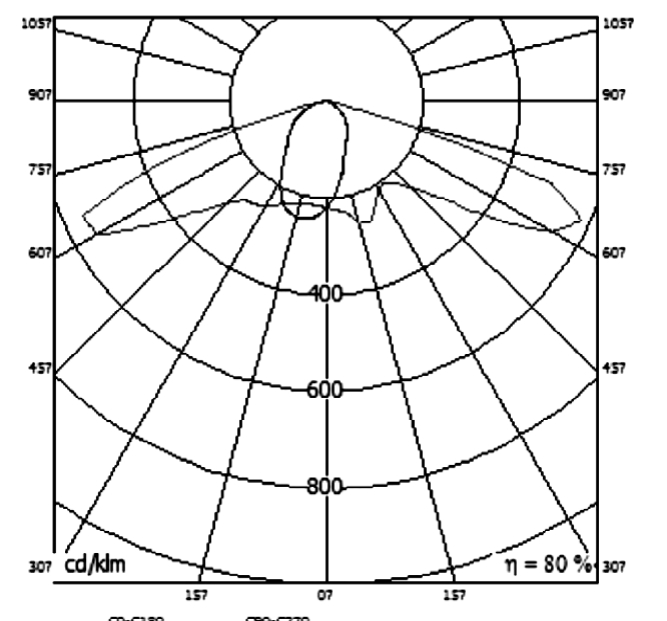
Figure 2 Light distribution curve analysis
Illuminators are installed on the road to provide the necessary visibility for vehicles and pedestrians at night. Road lighting can improve traffic conditions, reduce driver fatigue, and help improve road capacity and ensure traffic safety.
At present, high-power and high-brightness LEDs are developing rapidly. Due to its advantages of energy saving and environmental protection, LEDs have been widely concerned as a new generation of lighting sources. Compared with traditional road lighting (high pressure sodium lamps and metal halide lamps), the main advantages of LED street lamps are: good optical performance, quick start, easy control, high efficiency, power saving, energy saving and environmental protection, reliable and durable, long life, etc.
Metrics for road lighting
The road usually uses two indicators, the average illuminance and uniformity of the road surface. The former unit is lx, that is, the luminous flux of 1lm is uniformly distributed on each 1m2 horizontal irradiation area. The latter is the ratio of the minimum horizontal illuminance to the average horizontal illuminance.
Actually, the luminance distribution of the road is quite different from the illuminance distribution. Therefore, the International Commission on Illumination recommends using the four indicators of road brightness, uniformity, glare and inductivity to measure. It is suggested that the pavement brightness of urban arterial roads and expressways should be 2cd/m2, the longitudinal uniformity should be 0.7, and G=6.
1. Establish a Simulation Training Platform
The power of the road illuminator is 200W. Illuminators should use light energy reasonably to prevent glare. The light emitted by the illuminator should be irradiated along the required angle and fall on the road surface as a designated spot. The light distribution is uniform, the brightness is large and the glare is small. Therefore, the glare index of this paper is G=6, and the secondary optical light distribution curve is a bat-wing.
According to the specific road section form, width, vehicles and pedestrians, the street light can be arranged symmetrically on both sides of the road, staggered on both sides, one side layout, separated island double-fork layout and road center suspension layout.
The specific parameters used in this paper are as follows:
The established physical model of LED road lighting is shown in Figure 3. Different road models are established through DIALUX optical design software, which are:
(1) Symmetrical arrangement on both sides and staggered arrangement on both sides,
(2) The installation height of the LED light pole is 12 m and 15 m,
(3) The installation distance of LED light pole is 20 m and 25 m,
(4) The light source of the illuminator is high pressure sodium lamp and LED light source,
(5) LED light source power is 150W, 200W and 250W.
The actual scheme of LED road lighting is simulated under different LED road lighting simulation models. Calculate the actual average illuminance and uniformity of road lighting, and give the corresponding data report. For a specific actual road, under the premise of selecting the illuminator, the LED road lighting scheme of the road section can be given. And carry out simulation analysis to study the feasibility of the scheme.
Figure 3 Establishment of road simulation model
2. Example Analysis of LED Road Lighting
Taking a specific road in a city as an example, this road has a width of 25m, two-way three-lane, traffic flow > 2 400 vehicles/h, speed limit of 100km/h, and the road surface is asphalt.
According to the standard value of road lighting for motor vehicle traffic, this standard value of lighting is suitable for asphalt roads.
According to the specific parameters of road width 25m, staggered arrangement on both sides, separation island width 1m, three rows of two-way lanes, lane width 3m and other specific parameters, this paper selects the pole height of 12m, the installation distance of the poles of 25m, the maintenance factor of 0.80, and the road surface is R3 asphalt.
Open the DIALUX software and select the new road lighting.
The design scheme is given specific parameters, and the LED road model is established. When calculating the average illuminance and uniformity, just take one of the unit road segments. Therefore, this paper adopts the calculation area of 25m×25m as the unit road section for the calculation of the average illuminance and uniformity.
After the model is established, the next step is to import the lighting data. The designed bat wing light distribution curve IES file can be imported into the DIALUX software for calculation and simulation. In the process of simulation, different models can be compared and analyzed.
After the lamps are arranged, the calculation surface is set, that is, the calculation area of 25m×25m is the unit road section. Set the content of the calculation report and start the calculation. The power of the LED street light source is 250W, and the two sides are staggered. The installation height of the light pole is 12m, and the installation distance of the light pole is 25m.
Data Analysis
It can be seen that this luminaire meets the lighting requirements regardless of the average illuminance or uniformity. According to the analysis of its simulation calculation results, the road lighting scheme meets the requirements.
Synthesize different road models, conduct comparative simulation results analysis, and further obtain the key influencing parameters of LED road lighting effects:
(1) The installation method of the luminaire,
(2) The installation height of the LED light pole,
(3) The installation distance of the LED light pole,
(4) Illuminator light source power,
(5) The light distribution curve of the illuminator.
At the same time, it can be found that the larger the installation height, the farther the installation distance, the smaller the power of the LED light source, the smaller the average illuminance value, and the lower the uniformity.
Therefore, by adjusting according to different parameters, different road illuminance values can be obtained, and further simulation analysis can obtain the best road lighting scheme.
3. Conclusion
In the design of LED street lighting, the actual road conditions are simulated and modeled by DIALUX software, and the designer can better understand the key parameters affecting the LED road lighting effect. Through the analysis of the simulation results, we can further understand the LED road lighting design. At the same time, the simulation analysis of different parameter adjustment is carried out, and an effective and feasible LED road lighting solution is proposed according to the lighting quality indicators such as average illuminance value and uniformity.